How to show up/down arrow (shape) based on trend in Tableau?
- Tableau FAQs
- December 12, 2018

To implement this, you need to go through the following steps(we will use an example that will count the number of products):
– First, we need to make a calculated field where we would use a boolean expression to determine the amount for 2012 and 2013 as an example.
IF YEAR([DueDate])=2012

THEN [OrderQty]

ELSE 0

END
IF YEAR([DueDate])=2012 – here we specify the condition, the result of which should be TRUE or FALSE
THEN [OrderQty] – if the previous condition is TRUE, then we display data from the [OrderQty] field
ELSE 0 END – if the condition is FALSE, then the result of the logical expression will be 0
– The next step is to calculate Year Over Year Growth; for this, we can write the following simple expression using the calculated field that we did in the previous step:
(SUM([OrderQty 2013])/SUM([OrderQty 2012]))-1
SUM([OrderQty 2013] – this is the amount for the [OrderQty] field for 2013
SUM([OrderQty 2012] – divided by the amount of [OrderQty] for 2012
-1 – this is to show the difference
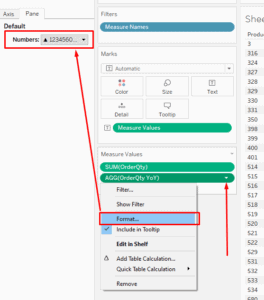
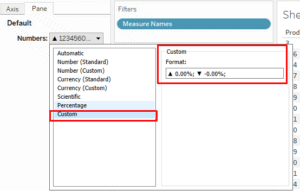
– At this step, you need to change the format of the numbers that we received in the previous step; for this, you need to right-click on the measure and do the following and add a custom format for displaying numbers:
▲ 0.00%; ▼ -0.00%;